
Pick any conversion agency's case studies and you will find a wall of percentages. 34% more revenue. 61% lift in add-to-cart. 212% improvement on mobile. What you will almost never find, next to any of them, is the sample size.
That omission is not an accident. It is the difference between a result and a coincidence, and it is usually the reason the number is large enough to put on a slide.
The cleanest way to explain this is with one of ours that does not hold up.
Our own example, which we do not claim
We rebuilt a product page for Pawpeye and ran it against the original as a 50/50 split for 17 days. The rebuild led the whole way: 7.53% add-to-cart against 4.26%.
As a headline that is a 77% lift. We could publish exactly that. Plenty would.
Here is what sits underneath it: 11 add-to-cart events on the new page, against 6 on the old one. Two hundred and eighty-seven visitors in total. Shopify put the win probability at 87.4%, against the 95% bar people normally treat as the threshold.
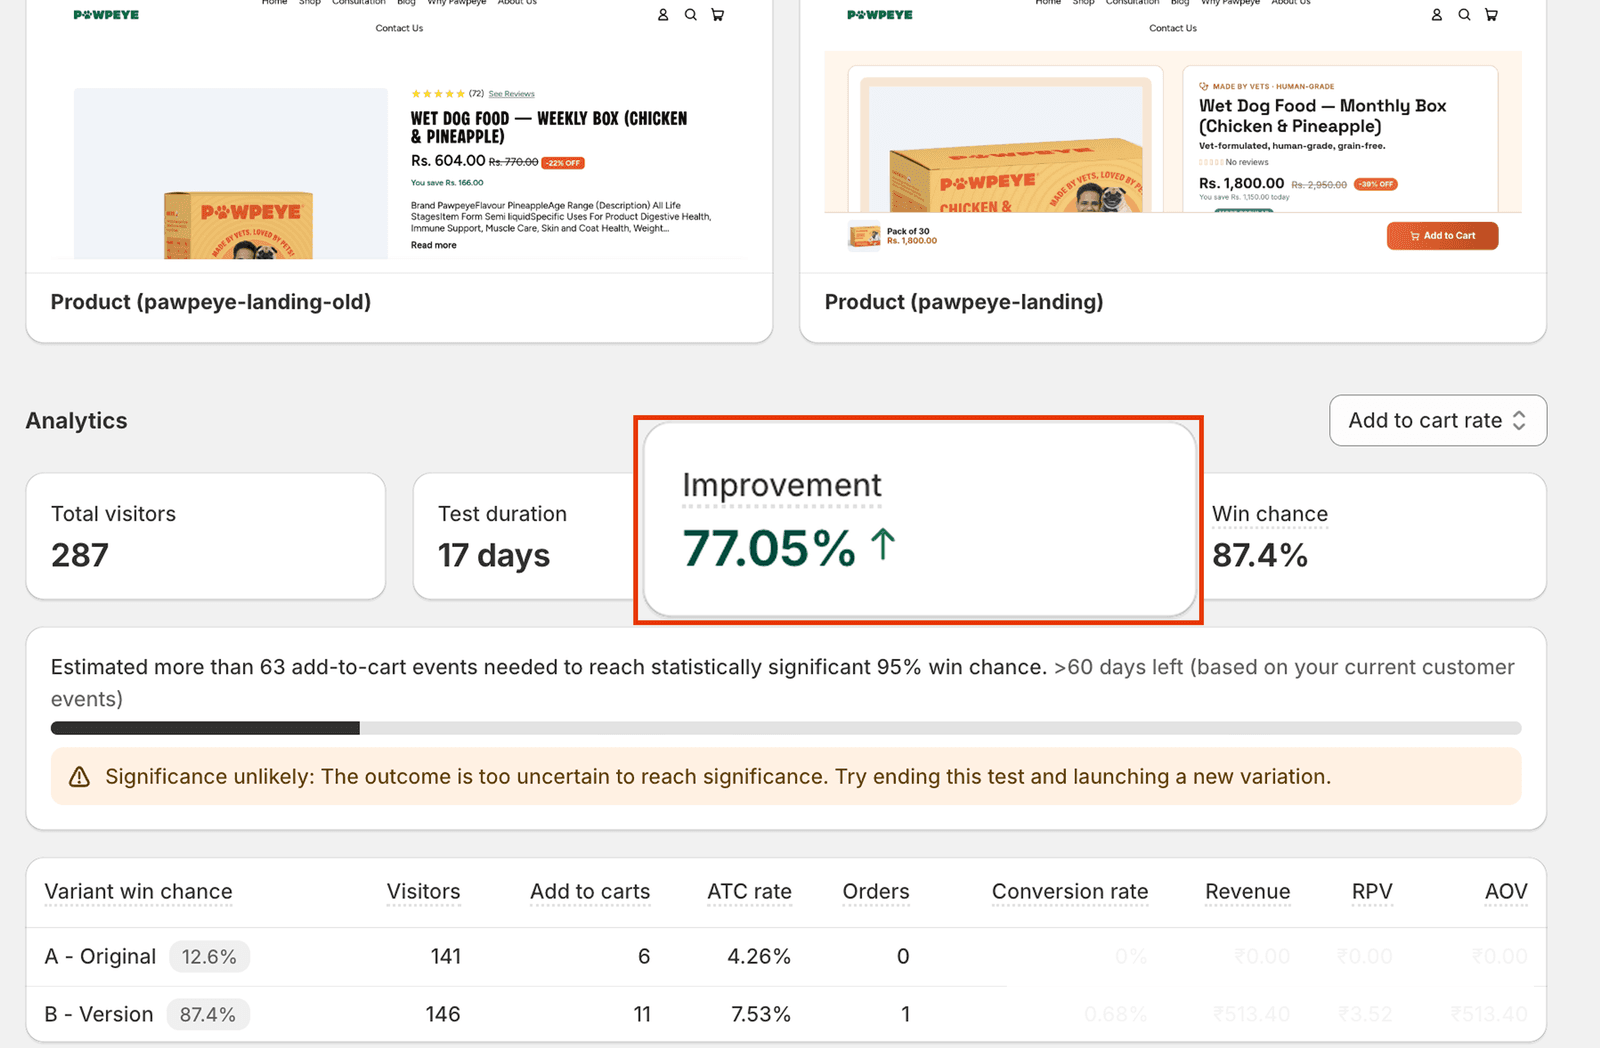
Five extra add-to-cart events over a fortnight is not a finding. It is the kind of difference a quiet week produces on its own. If two more people had added to cart on the original page, the "77% lift" would have been about 40%. If three had, it would have roughly halved.
A percentage calculated from single-digit conversion counts will swing wildly on one or two events. That is the whole problem, and it is invisible unless the case study tells you the counts.
Why small samples produce big numbers
This is the part that feels counter-intuitive, so it is worth stating directly: small tests do not produce small errors. They produce large ones.
With six conversions on one side, a single extra event moves the rate by about 17% of itself. Randomness at that scale is enormous relative to the effect you are trying to measure. Which means the tests most likely to produce a spectacular headline are the ones least likely to be real.
Agencies are not necessarily being dishonest about this. Run enough underpowered tests and some will show huge lifts by chance alone. Publish those, quietly drop the rest, and you have a portfolio of impressive numbers with nothing behind any of them.
The four things a case study has to tell you
Ask for these. A study missing any of them is not a study.
| What to ask for | Why | |
|---|---|---|
| Sample size | Visitors per variant | Hundreds is thin, thousands is meaningful |
| Conversion counts | Actual events, not just the rate | Single digits means the result is noise |
| Significance | p-value or win probability | Below 95% it has not settled |
| Interval | The range the true lift might sit in | A wide range means the headline is a best guess |
That last one is the one almost nobody publishes, and it matters more than the headline.
Our InStrength test did reach significance — p = 0.02, 99% win chance, 546 visitors — and the add-to-cart rate went from 12.94% to 20.38%. That is a real result. But the confidence interval around the size of the lift runs from roughly +9% to +106%.
So the honest sentence is not "we delivered a 58% lift." It is: the page is very probably better, and the improvement is somewhere between slight and enormous. Six days of data settles the direction confidently and the magnitude loosely.
Talk it through
Send us a case study you are being pitched.
Or your own last test. We will tell you what the numbers actually support — including when the answer is that a result you were pleased with has not settled yet.
Get it read properlyA real read within one business day — not a sales call.
Four tells in published CRO results
A percentage with no denominator. "63% increase in conversions" with no visitor count is unreadable by design.
Revenue as the headline metric. Revenue is noisier than add-to-cart because it compounds conversion, basket size and product mix. It moves more on less, which makes it flattering and unreliable in equal measure.
No losses anywhere. Roughly half of all A/B tests fail to beat control. A portfolio of unbroken wins is a filtered record.
"Up to." As in "up to 300% improvement". This is the best number they have ever seen, once, and it is doing a lot of work in that sentence.
What good practice actually looks like
Decide the primary metric before the test ships, and do not change it afterwards because a different one looks better. Estimate whether the page has the traffic to conclude in a sensible window — if it does not, test something else or accept you are running it for direction rather than proof. Let it run its planned course instead of stopping the moment it looks good, which is the most common way a real process produces a fake result.
Then report what happened, including the interval, including the ones that went nowhere.
Add-to-cart rate is usually the better primary metric on a product page test: it sits closest to the change you made, and it accumulates events faster than orders, so it settles sooner.
The uncomfortable summary
Most published CRO results would not survive being asked two questions: how many people, and how many conversions.
We publish Pawpeye with its dashboard and the word unsettled because a client who believes a 77% number that is not real will make decisions on it — and then blame the next honest agency when reality shows up.
If you want a straight read on a test you have run, or one you are being sold, send it over.
About the author
Manpreet Singh
Manpreet Singh is the founder of Proscube, an ecommerce growth studio. He leads the studio's Shopify and Shopify Plus engineering, headless builds, CRO, and its work on AI engine optimization, and writes its guidance on how to grow a DTC brand without wasting money. He works directly with founders — no account-manager layers between you and the people doing the work — and would rather tell a client not to build something than sell them work they don't need.
More about Manpreet